Forex trading sessions timing can be tricky to follow. To help you navigate there, we added the real-time chart of the trading hours in our popular product – Smart Forex Tester.
To activate the chart, click on the $ button on the Toolbar which will open the Automated Trader window. Then switch to the Time tab.
The graph will show you the whether the Market is open or not, and the time left for the opening and closure. In addition, this information is provided for each of 6 major trading sessions in Asia, Europe and the USA.
The graph is updated in real-time and is available in free version,
Smart Forex Simulator is our latest product that has just been launched. We offer it as our Cyber Monday deal this year.
What is it? And why is it “Smart”?
Smart Forex Simulator has all existing (and upcoming) simulator related features, including FF/Slow Motion/Pause and Time Shifting.
But also – thanks to inbuilt real-time Pivot Points Analyzer – it can generate market timing signals (the main reason why we call it “Smart“).
And finally, you can integrate it with Metatrader. So, you can not only test on live prices provided by your broker, but also import PPA signals in real time into your Metatrader client terminal for real trading.
We can also call Smart Forex Simulator “Smart Forex Tester Suite lite”, because it includes all the functionality of our flagship product – except for C++ programming framework.
If you don’t need trading automation, Smart Forex Simulator is the right choice.
5 Reasons Why you need Smart Forex SimulatorClick HERE to Order Now
Next weekend our subscribers will get an email with the details on how to grab our flagship product – Smart Forex Tester Suite 2.0 – with a big discount.
Stay tuned! Please make sure you don’t miss our email. The offer will be valid for a short time only.
If you are not our subscriber yet, please subscribe here – it’s free!
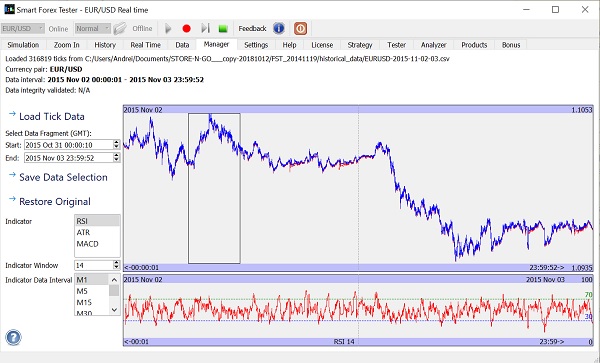
Forex Data Manager is a tool to prepare your own test data files, which is especially handy for batch testing.
Why is it needed? To make your testing very efficient.
If you test on the original historical market data files, the testing might take days to complete. Because these can be very large.
For example, if you use (as we do) free monthly tick data files provided by truefx.com, they can be several hundred of MegaBytes in size.
This is why we added the batch testing feature. It helps you to only test the most interesting market action and don’t waste time for the rest. You can compile a test batch from a relatively small test files and run them all automatically one after another.
With the Data Manager, making these test files is very easy.
Data Manager is a tool to prepare the data for batch testing
First, you load a master data file in the program. For example, a monthly file we mentioned above.
Then, you view the market action, zoom in if needed, and find the market action that you would like to test your strategy against. Then you save it as a separate file, which is much smaller in size. So the tests can be completed in much shorter time.
This way, you can compile different test batches that evaluate your strategy in different market conditions. For example, you can prepare a batch that will have a set of market action for different currencies after a rate decisions or other major news announcements.
Another examples can be a set of powerful trends, sudden trend reversals, etc.
We have changed the structure of our free licenses.
Currently supported are the following free products:
Online Forex Simulator
Practice Forex live without any account! Real prices for 10 main currency pairs. Save the live price data locally and use it later in the Offline Simulator.
Time Shifting and variable data rate save your time.
Offline Trading Simulator
Practice trading even if the market is closed – this is impossible on any demo account! Tick-by-tick data ensures 100% market modeling quality – no interpolations. Up to 1 ms accuracy. Variable data rate to save your time. Data manager to prepare your historical price files.
If you have the release 2107.0512.46 or earlier installed, you need to update to the latest version to make sure your software work properly.
Market entry timing is critical for success in Forex. How can we decide when we need to open a position? Or to close it.
Have you tried using indicators for that? If yes, was your experience successful?
We did try and the results were not good at all.
The problem is that indicators are averaging, and so they lag by definition. Indicators can give you a “helicopter view”, but they alone are not good market timing tool.
Just one example – RSI. When it drops below 30 (or exceeds 70), it is widely used as oversold / overbought sign. But you probably have seen how RSI can not only stay in this state for substantial time, but reach even more extreme values.
We use the nature of the market – price discovery mechanism – to make the decisions. The markets always move from an extreme in one direction to the next – in the opposite.
Pivot Points Analyzer is a product we created for that. Watch this 20 s video:
The colored dots are the pivot points generated by our software in real time. The market tops are marked red, the bottoms – blue.
Would you like to have access to such signals in your trading?
For market entry timing in the day trading, you can use the Pivot Points Analyzer as is. On the longer time frames, it would be best to combine its signals with indicators. This combination will give you the best of both worlds.
Obviously, some signals are false alerts. I.e. the market doesn’t turn the direction.
But even if this is the case, we can notice that the market usually slows down and seesaws around these points. So you may have the time to exit the market to minimize the losses if you are unsure.
Pivot Points Analyzer was recently added to the Smart Forex Tester Suite. Which now gives you all needed to effectively develop and test trading strategies.
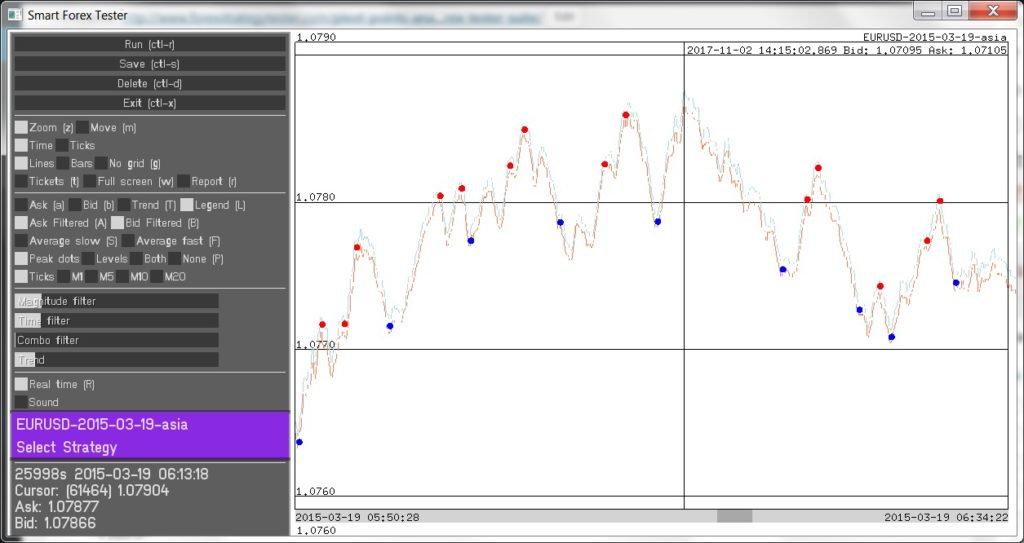
Pivot Points Analyzer (or PPA)is a new software to detect market extremes in real-time.
The value of the Pivot Points Analyzer is in that it can generate real-time market entry and exit signals like those shown on the screenshot below.
Pivot Points Analyzer detects tops (red) and bottoms (blue) in real-time
The picture shows the signals generated for about half an hour. Red dots indicate market tops, and blue dots – bottoms. Note that it is just an example – you can tune the detector to look for more or less extremes.
Would you be able to profit from these signals?
We believe so. Even though the detection is obviously not ideal, quite many signals are spot on.
If you would buy at the time a blue dot appears or sell when a red dot signaled, you could definitely close the majority of these positions with profit.
The PPA algorithm is principally different to that of indicators that are widely used in attempting to predict the market direction.
Indicators are lagging so they can’t be successfully used for timing the markets.
Whereas the Pivot Points Analyzer, while following the big picture, works in real time with only a minimum lag.
A bit more details on what “real-time” means. The picture shows many dots simultaneously, but every dot was generated exactly at the moment it is plotted. In other words, each dot is detected based on the market data available only before this time.
PPA signals can be used on its own, especially if you do day trading. But you can also use it as a building block for more sophisticated trading strategies. Here you can benefit from combining the PPA with indicators.
Important to notice, that PPA can help to minimize the losses, even if the signal was a false alert. In other words, this means the PPA signaled the extreme that is not big enough to be a pivot point.
Usually, even at small extremes, the market slows down and seesaws. So you will probably have enough time to exit if you are unsure. And you may even make a little profit from a good timed entry.
The Pivot Points Analyzer is a very powerful tool to build your trading strategy.
The PPA is now a part of the Smart Forex Tester Suite. Which means that the Analyzer is complemented will all needed to efficiently develop and test all PPA-based strategies.