THIS PAGE IS DEPRECATED!
The example is based on the old software. We are porting it to the new platform.
Subscribe to download the latest Smart Forex Tester software and be notified when the strategy is ported.
Here we will give an example of a simple day trading strategy building with our Smart Forex Strategy Tester software.
We will be referring to the working example that is included in the software bundle. The test data is also included there. Download the latest Smart Forex Strategy Tester software.
So you can repeat our example yourself and test our strategy and play around with it by changing parameters. The strategy file (day-trading-strategy.stg) is located in the data subfolder of the build.
Day Trading Strategy Based On Pivot Points
We will use market swings that happen on any time frame. Our example day trading strategy will be very simple. On getting a pivot point signal, we enter the market in the opposite direction. Once our position becomes profitable, we wait for a pivot point in the opposite direction and close the trade. Stops will be static.
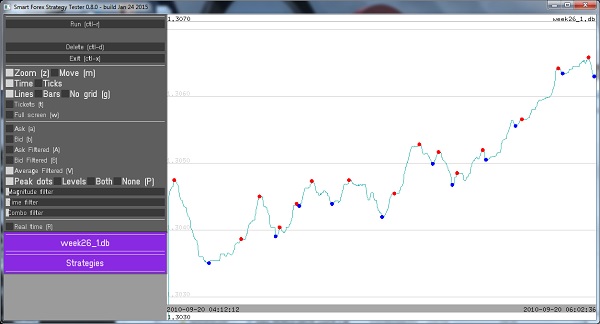
To detect pivot points, we developed an algorithm that does it in real time. We use it for timely entering and exiting market – which obviously is very important in day trading. The strategy we will develop in this example will be using the signals from our Pivot Point Analyzer tool. The screenshot below shows example of tops and bottoms detection.
This tool is integrated in the Smart Forex Strategy Tester, and you can try it via the GUI. Refer to the User’s Guide how it works.
Note that you can adjust the parameters of the pivot points detector. We can do that based on the results of our testing. So in addition to the day trading, the same strategy can be used for trading on different time frames, as well.
Forex Trading Strategy Is A State Machine
Our software defines a trading strategy as a text-based state machine, which is a convenient method to define the behavior of deterministic systems. A state machine has states, events and transitions. In each state we must define the events that are associated with it and specify which event triggers transition and to which state.
A very simple example of a state machine is that for a push-button switch. This machine would have only two states – on and off. There would only be one event – button push, which in the state on would trigger machine transition to the state off and vice versa.
A state machine to describe our day trading strategy is of course more complicated.
Main states we use:
- Flat. This is an initial state. We also get here whenever our position is closed.
- Going Long. Here we get after an indication we might have a market bottom.
- Going Short. Same as above, but for market top.
- Long. Here we get from Going Long after a market bottom confirmation signal.
- Short. Same as above, but for the Going Short.
- Long Profitable. Here we start looking for a moment to close our BUY with profit
- Short Profitable. Same as above, but for SELL
Events. We will use 4 events that are generated by our pivot point detection algorithm. They are max / min of the slow / fast filters. Let us explain them.
Our algorithm filters market quotes to avoid false signals triggered by fluctuations which are always present. We use two filters – “slow” and “fast”. Slow filter uses more data to make a decision, which comes with bigger delay than that for the fast filter.
We detect pivot points by first waiting for the signal from the slow filter. This indicates us that the market might have peaked (or bottomed). After that we start waiting for the confirmation from the slow filter. But we can cancel our waiting if in the meantime market resumes its move so that the absolute top or bottom didn’t hold. Otherwise, we wait for the signal from the fast filter and then decide on the pivot point.
Though quite simple, this algorithm actually works pretty well. Take a look at the screenshot above. Red dots show detected tops, blue dots are bottoms. Note also that they were detected in real time – i.e. for each pivot point, the analyzer only used the market data that existed prior to that moment of time.
You can get a feeling of how it all works by playing around with the Pivot Point Analyzer.
Continue to simple day trading strategy building example part 2, where we will describe transitions, explain the strategy file and proceed with strategy testing.
Hi ppl.
look what happens when I try to run the app.
https://goo.gl/MZbRR2
Thanks.
Hello
your video (https://goo.gl/qdlzjA) shows that your graphics chipset doesn’t support OpenGL 2.0 that is used in the Smart Strategy Tester (see details here: https://communities.intel.com/message/89237). There are advices to install drivers from intel instead of native Windows – this might or might not help.
So you need to either upgrade the driver or use another machine.
Cheers!
Forex Strategy Tester Team