A long awaited feature of Optimizing Pivot Point Analyzer parameters is finally available – in the just published new release of our flagship product – Smart Forex Tester Suite.
 Optimizing Pivot Point Analyzer parameters makes the detection of the market extremes more accurate, because now you can adjust the detector parameters to best fit the recent market price action.
A convenient way to get the data for the optimization is to save the latest ticks acquired in the Suite when you run it on real-time data feed. For that, go to the Real time tab and use the Save ticks button to store the ticks to a file.
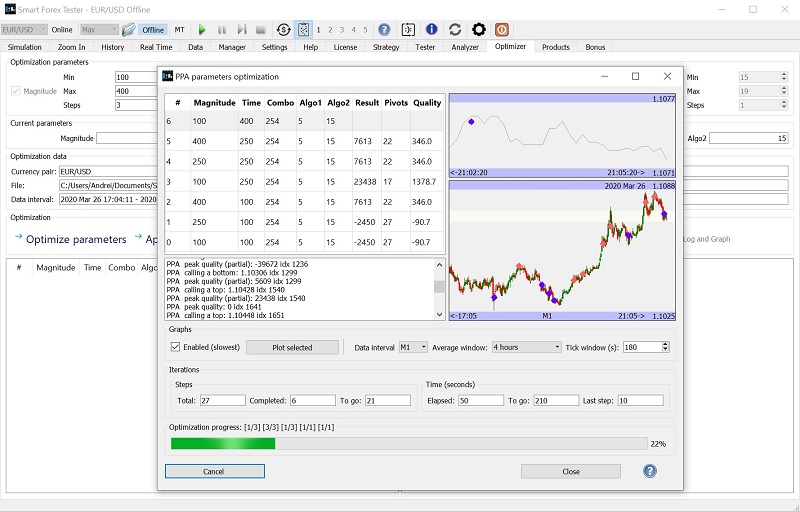
Then on the Data tab, load this file and go to Optimizer tab. There select the ranges for the parameters, and the accuracy you want (number of iterations). Then click on the Optimize parameters button and the Optimizer window will open.
The upper table shows the results of the optimization, and you can also monitor the process on 2 inbuilt graphs. When the software completes the calculations, you can plot the graph for each set of parameters. For that, select a line in the table and click Plot selected button.
When you finished, click Close button. The Optimizer window closes but the software will copy the results into the table on the Optimization tab. There you can select the best parameter set and make your strategy use it by clicking the Apply parameters button.
For each price extreme, the optimizer calculates its quality. The algorithm evaluates the extent and speed of the price change after the signal.
Maximum quality corresponds to the situation when the price immediately goes in the direction opposite to the signal, e.g. decreases for a market top signal.
The Quality parameter in the result table is an average of all the extremes detected in the single test.
In the future versions, we may modify the the software to run this optimization in a rolling fashion on the background.