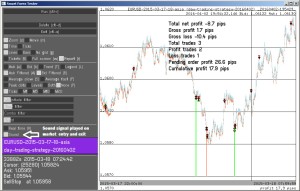
Live forex signals can be generated for free with our Smart Forex Tester.
When we run the Tester on real-time market data feed, we can trigger automated forex signals every time when our day trading strategy is entering or exiting markets.
Signals are short sounds. They can be turned on or off in the Tester GUI, and the tunes can be configured for each of the market events.
Sound-button turns on live Forex signals
The live data is sent to the Tester by our Forex Simulator, which in its real-time mode supports 10 main currency pairs. This short video shows how the Tester and Simulator work together. (The signal is at 3.10)
Alternatively, the Tester can receive live market data from a Metatrader client terminal via a special Expert Advisor. This EA you have downloaded together with the Tester.
The Tester GUI provides you the controls to change the main strategy parameters. So you can experiment with them to adjust to the current market situation.
Want to try yourself how accurate these live Forex signals are?
This post continues the topic we started in our latest post on the adaptive trend following strategy. All figures refers to the example of a trend that we covered in that post.
Our Forex Trend Indicator Works In Real Time
For automated trading strategies that we develop and test with our software, we only use indicators that work fast and a value is available ideally at every tick.
Our trend indicator works in real-time as well. It is recalculated on every coming tick using a sliding window of a fixed length starting at the current tick.
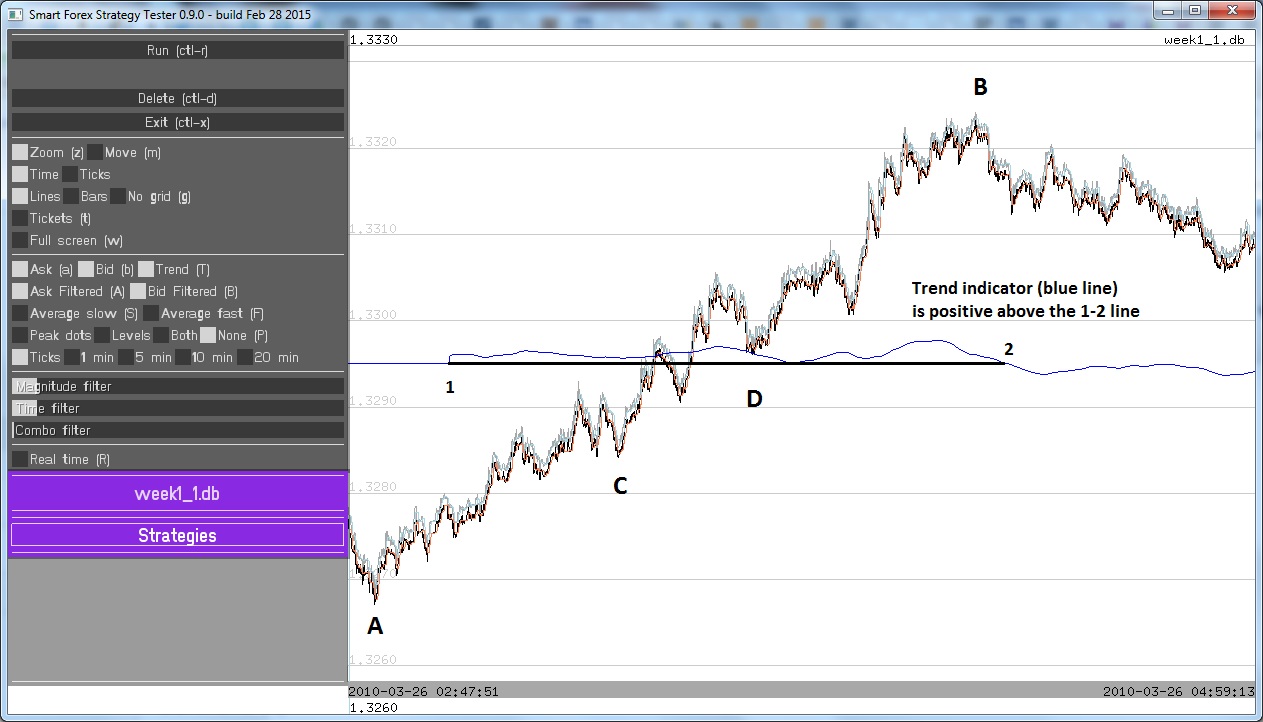
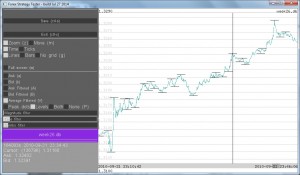
Let’s see how the indicator works. The figure below covers the same interval as the figure 2 in the post on trend following strategy.
There we noticed, that staying in the market in points C and especially D is not easy – risk looks very high and you might want to take profits.
How Forex Trend Indicator Works In Real Time
The trend indicator is plotted with a blue line. It starts from the horizontal segment on the left, which is a zero line. The indicator is zero, as there is not enough data yet to fill the full computation window.
But once the indicator start getting calculated (starting form the point 1), trend indicator yeilds positive values – until point 2. So we can see that if our automated strategy used this indicator, it would not exit the market in C nor in D.
You can download the latest Smart Forex Tester software and try analyzing the trends yourself. Use the trend-checkbox on the left panel to turn the indicator on or off. You can also adjust the computation window size with a slider control (requires data file reload!).
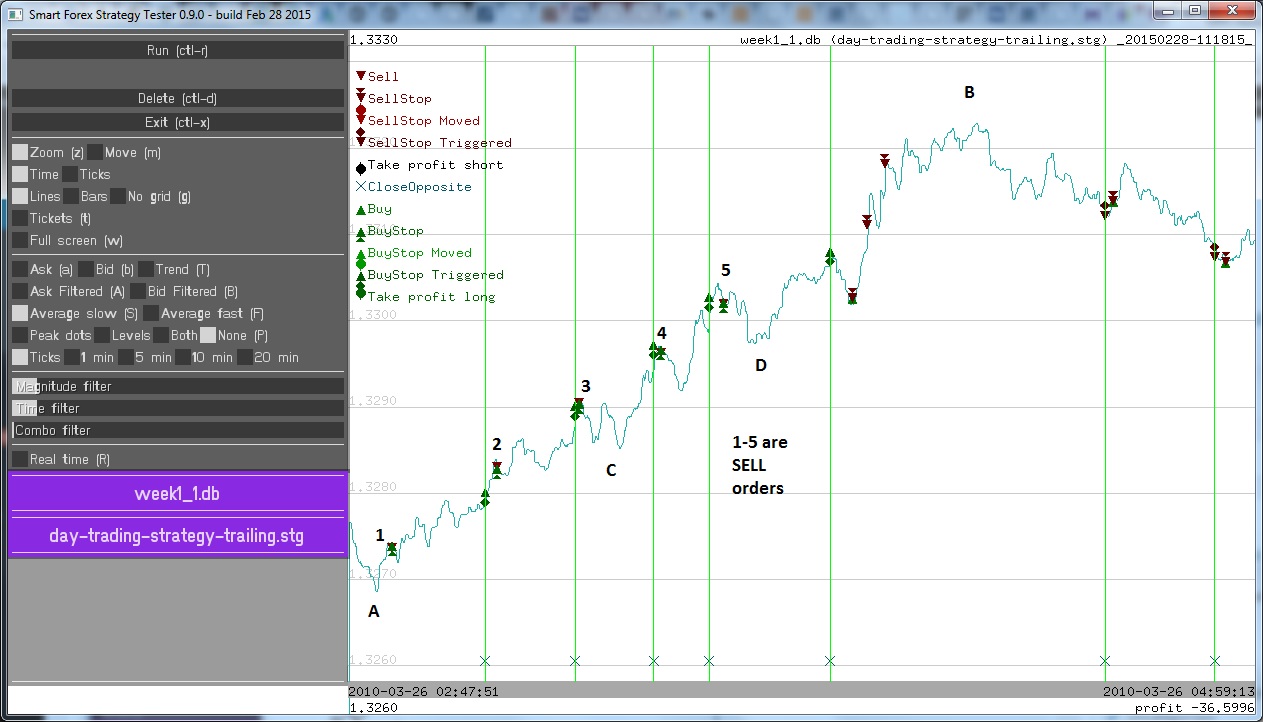
Starting from the next release, this Forex trend indicator will be also made available to trading strategies as a signal. Then we will include it in our trading strategy and update the below example to see how will trend indicator works in practice. Stay tuned!
We can see that market entry in pivot points is flawless. But the direction is wrong. So it will be really exciting to improve the strategy by adding the trend indicator and retest.
In any market, including Forex, trend trading is potentially the most profitable. However, to get decent profits, you need to catch a trend early enough. Which is not easy, but doable, because Forex trends usually last quite long.
What is considerably more difficult is to have enough self-control and not to leave the markets too early. Market doesn’t move in a straight line and it’s impossible to predict where the market tops or bottoms.
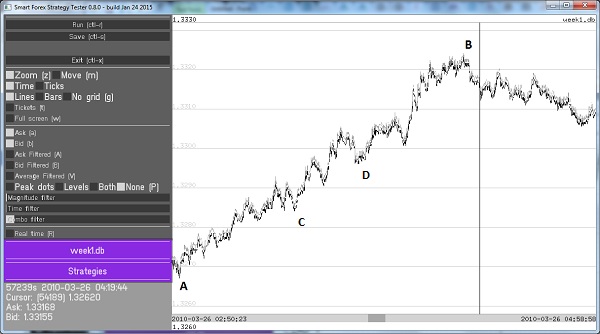
In hindsight, spotting a trend is an easiest task. This one a clear trend, right? From the bottom A to the top C market advanced almost 200 pips! And along the way, the rise from A to B looks even more obvious. It appears easy to get in somewhere in between and still have enough profit potential.
On Forex Trend Trading Strategy Development – Big Picture
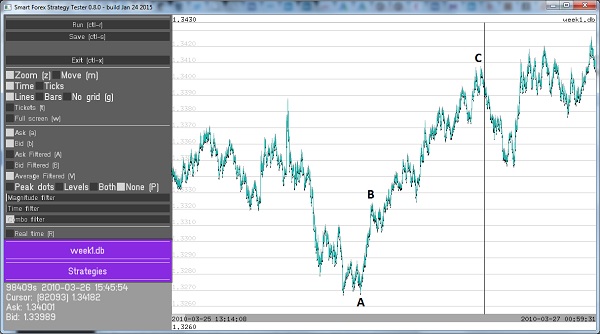
But let’s take a closer look. The next picture shows the closeup between A and B that covers about 2 hours of trading .
On Forex Trend Trading Strategy Development – closeup
You can see that A-B that seemed an obvious trend on an averaged graph, now looks completely differently. And when you follow the market in real-time, the picture will be much more uncertain. And this is exactly the timeframe where decisions have to be made.
You get the idea. Suppose, you are extremely lucky and entered a trade at the bottom A. Will you still dare to stay in the market at C? Or D, for that matter? And in the big picture, A-C or A-D are only small fractions of the whole trend.
So what trend trading strategy should we use? Which works better: wait for the ultimate top or bottom and lose profit or fix profit on reaching a certain level only to watch how market continues to advance in the same direction? How to address this dilemma?
Forex Trend Trading Strategies Need Adaptive Algorithms
In our opinion, Forex trend trading must use real-time strategy adaptation. And it needs reliable and fast signals about local tops and bottoms. We are developing our trend following strategy based on signals from our pivot point detection algorithm and our real-time trend indicator.
The main idea is to try to enter market on very early signs of emerging trend – not to be late. This is impossible to predict, as any trend indicator won’t give any signal so early. So we need to do it by trial and error. And tune itself on the market as trend develops.
Here is where our pivot point analyzer comes very handy. It can nail a top or bottom very accurately – and in real time. This is important as it gives us a chance to win some pips on the counter-trend movenens – even if we didn’t guess the bigger trend direction.
And this buffer allows us to take more risk. Suppose we decided to call a market top at the peak to the left of D. And opened a short position to trade a possible market reversal. We have in this case enough potential not to lose when the market eventually ends its correction in the point D. And we can use the same approach and enter the market at D againg, but now in the opposite direction.
Another level of adaptation is the pivot point detection algorithm itself. We can use the market direction information for more reliable pivot points detection. The idea is to introduce asymmetry in the peak analysis process.
So, e.g. for an ascending trend, we need to raise the detection threshlold before picking a possible top candidate, because the chances are higher that the market will continue higher. At the same time, we need to lower the threshold for bottom candidates.
Adaptation is also needed to adjust the thresholds depending on the nature of the trend: the steeper it is the bigger changes are needed in the threshold values compared to the default values that work in flat market conditions.
The very same ideas and algorithm for market entry are fully applicable for exiting the market or taking profits. Here we won’t discuss the case of exiting the market with a stop-loss. And the most important case where this method is needed is trend following.
Standard practice of taking profits is placing a takeprofit order with trailing. Trailing order follows the current market value, being behind it for configured number op pips. At the first glance, the idea is excellent, but the problem is again the market volatility. Trailing order only goes in one direction, so if placed too close to the market, it can be triggered by a pullback. This happens a lot, e.g. because many market operators like to do “stop hunting”.
We suggest using our algorithm to make trailing logic more flexible. To avoid excessive or false triggering, we set the stop level far from the current market level. Basically just over the break-even level. And next we are detecting the local extremes by our algorithm. Once they are identified, we move the stop order close to the extreme. If the market continues moving to the same direction, and we are lucky and the order is not triggered by a pullback, we just repeat the procedure until the stop is triggered.
Trend Following Is Benefitial Only With Accurate Signals
Once the stop is triggered, we are waiting for the next significant extreme in the opposite direction and decide whether we want to re-enter the market in the same direction. This can be lucrative if the trend resumes. However, we can never predict that, so at some point the last re-entry will most probably be a loser.
There is also idea to profit from pullbacks. Which is often called “catching a falling knife”. Which means that having fixed our profit, we open a position in the opposite direction.
This is extremely risky trade, but on strong trends it can be very profitable.
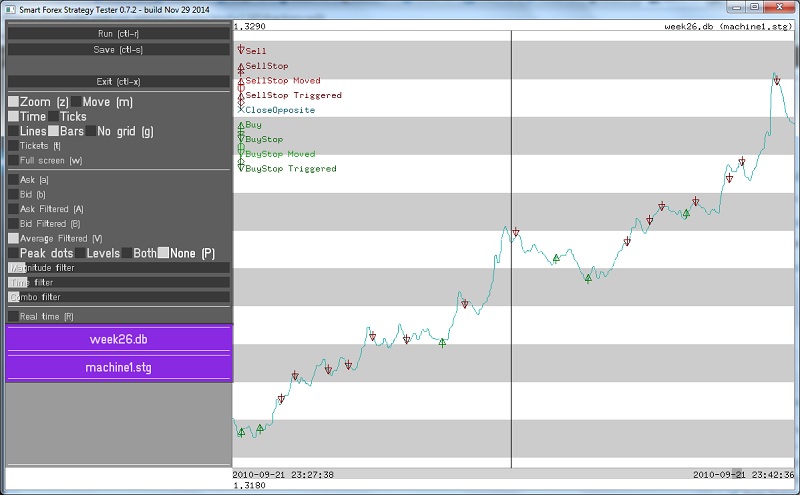
For trend following trading strategy, we use our pivot point analyzer as a trend indicator. As the figure below shows, once we have a trend, the output of the detector is mostly the peaks in the same direction (maximums for the uptrend seen on the screenshot). This, along with other simple geometrical measures makes trend identification quite reliable.
Trend Following Forex Trading Strategy: Trend Confirmation By Pivot Points Analyzer
Forex trading strategies are using multiple time frames. However, even if you are not a day trader but just want to open a long-term position, you have to enter and exit the market in the real time. Period.
This means we have to deal with daily volatility, which can sometimes reach 2% and even more. This is a significant number for leveraged trading. Even if the trading strategies are to stay in the position for long time in anticipation of bigger gains. Good entry timing not only gives you more profit, but also lets you place better stops.
Indicators are of no help in real-time here because they are lagging. E.g. popular oscillator indicators like RSI can show extreme values for days. Market may really be topping or bottoming, but you won’t be able to find the best moment to enter the market.
Markets don’t move in a straight line. Even powerful trends always have pullbacks. The only reliable observation we can make is that we always see zigzags. If we see a local top, this will always be followed by a turn and then a local bottom.
In addition, markets have a fractal nature. It means that the pattern we see on a short time frame will become a smaller part of the same picture on the longer time frame.
Here is couple of examples how the algorithm works. Both refer to the same sample of market data covering only couple of hours. The detected pivot points are shown as black dots on the graph.
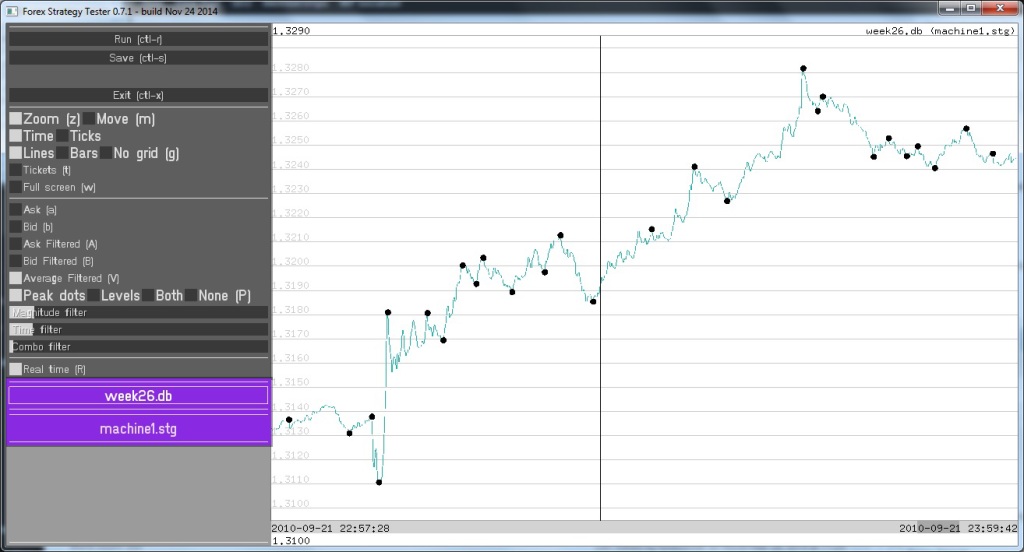
Example #1. Price action algorithm based market signals for Forex day trading strategies
You can see that the volatility for these 2 hours is over 1%. The graph is an average of bid and ask, slightly filtered for easier viewing. Note that the pivot points are calculated in real time. I.e. each point is only evaluated based on the price data to the left of it.
In the example #1, the algorithm sensitivity is set higher (note short horizontal sliders) and it captures more pivot points. As you can see, during these 2 hours the algorithm generated almost 30 signals. Which are definitely can be used for profitable day trading strategies.
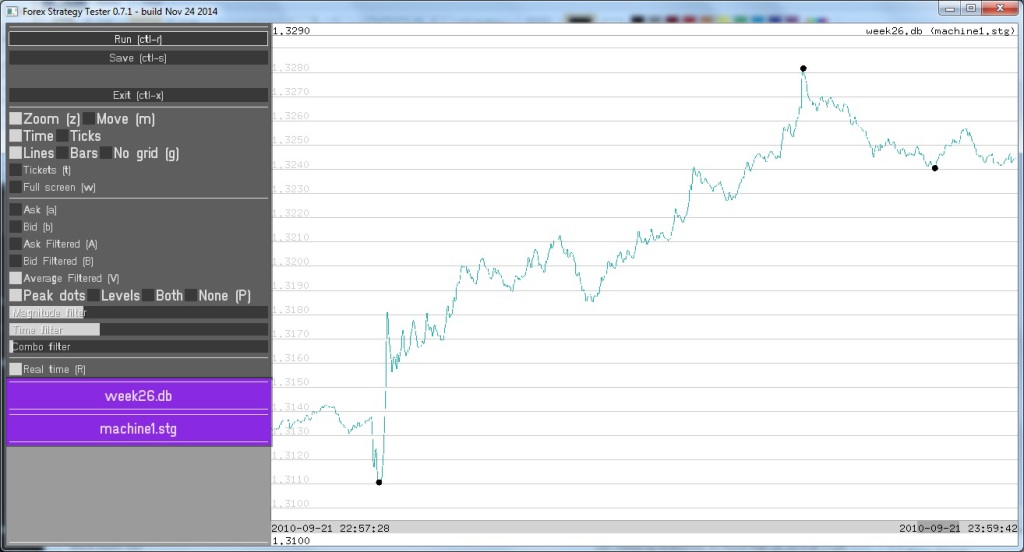
Example #2. Price action algorithm adjusted for long-term Forex trading strategies
In the example #2, we lowered the sensitivity of the algorithm (see longer values of horizontal sliders) and it only detected 3 pivot points within same 2 hours. You can see that all 3 are profitable market entries. Moreover, the algorithm managed to capture both the market top and bottom for given interval.
Forex signals are notifications of the moments when one should enter or exit the markets. How to generate them?
Note that the accurate decision to enter or exit has a value of its own. It can be completely independent on the used trading strategy.
Even if the strategy is a long-term, and is targeting a profit of hundreds of pips, it is always beneficial to make additional pips with successful market timing.
And of course, timing is absolutely essential for intraday trading, when the daily trading ranges over 100 pips are rare.
We have developed an algorithm that makes it possible to detect market pivot points in real-time.
Forex Signals At Price Extremes
The idea is based on the observation that it usually takes time for important peaks or pivot points to form. In other words, even if the price has already reached its extreme, it most often oscillates around that value for some time.
So it might take quite a while before the prices start eventually moving faster and farther in the opposite direction. Then, at some point, this process will repeat itself.
Of course, if the market is trending, the extremes against the direction of the trend will be formed faster. But the idea is still valid.
Our algorithm uses this knowledge and runs the price curve through several filters with decreasing time constant.
The filter with the biggest time constant (slowest) will detect the peak price value with some delay. At this moment, we check if the current price value still doesn’t exceed the signalled extreme value. If not, we start looking at the output of the faster filter that signals for the next extreme in the opposite direction. This is the moment to enter the market.
On the below screenshot, you can see how well the tool works. Detected pivot points are marked with short horizontal lines.
Forex Signals By Pivot Points Analyzer
Note that these pivot points are detected in real time. Meaning that each point marked on the screenshot was detected only based on the price information that was available to the left of it. This makes the algorithm very valuable.
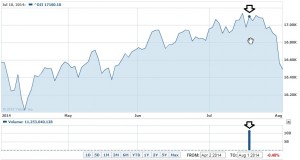
Recently we found an interesting illustration to our method from the stock market.
On the below picture (Dow-Jones), apparently a lot of trading signals were generated at the point shown by arrows. Note the daily trading volume (10B) exceeded its average value (below 0.1B) more than 100 times!
If you look closer, you can see that this point matches pretty well the algorithm we discussed.
Trading Signals After The Pivot Point
If We Need To Use “Plan B”
We need to understand, that, of course, there is no silver bullet. There is no way to tell beforehand, for how long the detected pivot point will stay a pivot point. However, what we do know is that the price line will have peaks and bottoms following in succession.
Suppose that we misjudged the “ultimate” pivot point. And the point where we entered the market turned out to be only the local extreme. So after our entry, markets will make a peak in the opposite direction and turn back.
Still, entering markets close to the extreme gives us clear advantage in this case, as well. We will have more time to react to the direction change. And also more pips to spare to minimize our losses.