This page is deprecated. We switched to C++ strategies.
Download new Smart Forex Tester. (requires FREE subscription)
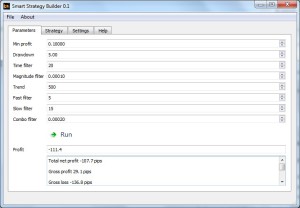
We have developed the first version of Smart Strategy Builder.
Smart Strategy Builder GUI
Currently we are testing the prototype and will make it available to our subscribers soon.
The Builder reads a trading strategy file and makes it all the strategy parameters visible and editable in the Builder GUI. There you can also edit and save the strategy file itself.
You can test the changes in the strategy or its parameters by clicking a “Run” – button. The Strategy Builder launches the Tester and executes the strategy test on the previously selected test data. The results are returned to the Builder and shown in the GUI.
The Tester GUI is also shown during the test and also some configurable time after its completion. All Tester functionality is available. You can analyze the trades in the GUI and also in the log, as usual.
The current values of the parameters are saved in a temporary file. So the Builder can restore them on the next start-up.
Smart Strategy Builder Development
When completed, this tool will take our automated trading strategies development to the next level.
Later releases of the Builder will extend our strategy format. While still using the standard state machine for routine trading operations, the Bulider will support the arbitrary code for market signals.
This way, the Builder will make the first steps to support the EA syntax as a strategy definition.
Forex strategy optimization is a must before using it in real trading. How exactly to do the optimization?
A standard practice is back testing on the historical market data. As each strategy has a number of parameters, we need to repeat tests for different parameter values and find out the values that make the most profit.
Parameters are independent, so the number of available combinations can be substantial. Consequently, solving such a problem of finding a multi-dimensional maximum can take a considerable time. Especially if tests are run on a long data interval.
To complete tests in reasonable time, it makes sence to test first those parameters combinations, which are believed to have the most influence on the risk level. Using market patterns, e.g. trending or rangebound market, is another way to reduce the computing time.
Another problem is – how much historical data should we use? What is the minimum data interval to test on to be confident in our strategy? There is no correct answer here.
In our example, our automated trading strategy was optimized on one month of data for Asian trading sessions. Asian trading is the least volatile and easier to trade. Still, for the next month the same parameters resulted in losses.
Back testing can’t guarantee success – Forex market is unpredictable. Does it make sense to test at all?
Our approach is to monitor the market in real time, and adapt the strategy to current market conditions on-the-fly.
Forex Strategy Optimization In Real Time
Strategy optimization with back testing can be called static, because the outcome of the tests are some fixed set of parameter values that is used unchanged in future.
Our approach we can call “dynamic” optimization. Contrary to static approach, here the tests are run in real-time on the latest market data. and so the test data always changes. We are working on an algorithm for adjusting the strategy parameters on-the-fly.
Dynamic optimization is an important part of our strategy development toolkit, which already includes a real-time pivot point detecting algorithm. Which generates trade signals at market tops and bottoms. As you understand, optimizing the detection process in real time will have an enormous profit potential.
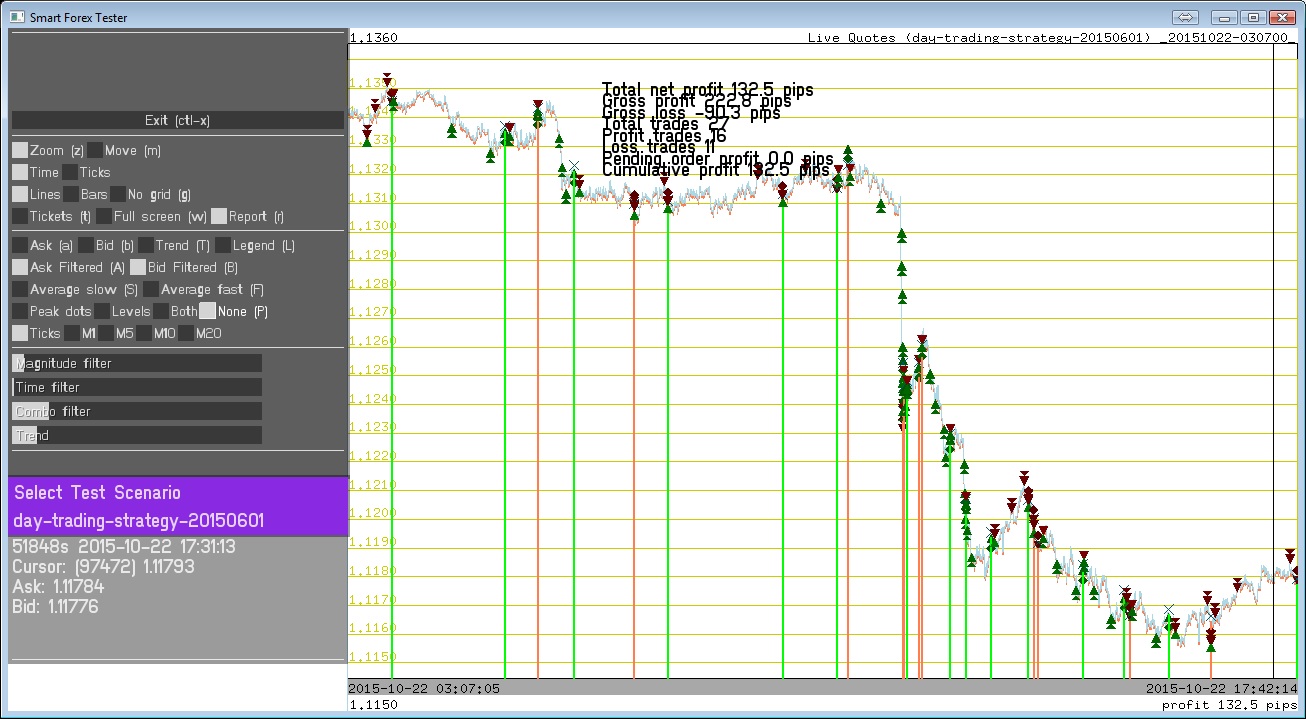
You are probably aware of the sharp drop in the EURUSD on October, 21. Following the ECB announcement, the Euro fell over 2% against the Dollar.
It happened so that on that day we were testing the latest version of Smart Forex Tester. This upcoming release of our software will support forward testing – i.e. test the automated trading strategies on live data feed. For that, we have developed a special Expert Advisor that sends tick data from Metatrader.
So, we were running the stability test. We were using our automated trading strategy (comes bundled with with Smart Forex Tester). We left the tester running on its own. When we checked it the next day, we were stunned. Not by the fact that the tester was still up and running (this was expected).
Smart Forex Tester runs automated trading strategy in real time (click to enlarge)
What came as a surprise was that our automated strategy absolutely crashed it! It did 27 trades, out of which 60% were winners. And it raked 132 pips profit!
Automated trading is the way to go!
This test convinced us again that automated trading can be made profitable. We understand, that for this simple strategy that we were using, we had a bit of luck. The reason being that this strategy doesn’t yet have a trend following algorithm. We are only developing it.
Our line of reasoning is simple. First, to be successful, a Forex trader must have a clearly formalized strategy. Second, this strategy has to be strictly followed. No room for emotions. Now, if we have done the former – guess who will be more successful in the latter – a person or a computer? The answer is obvious.
If you are interested – stay tuned! Download Smart Forex Tester and wait for the announcement of the latest release.
Stop loss orders are essential part of leveraged Forex trading, where the risk of margin call is significant. Manual trading without stops is of course possible, but it requires constant monitoring. For automated trading, stop loss orders are evidently a must.
Here we will discuss some ideas how stop loss orders can be optimized in an automated Forex trading algorithm. We will suggest market adaptation of the stop loss orders position based on our pivot point detection algorithm.
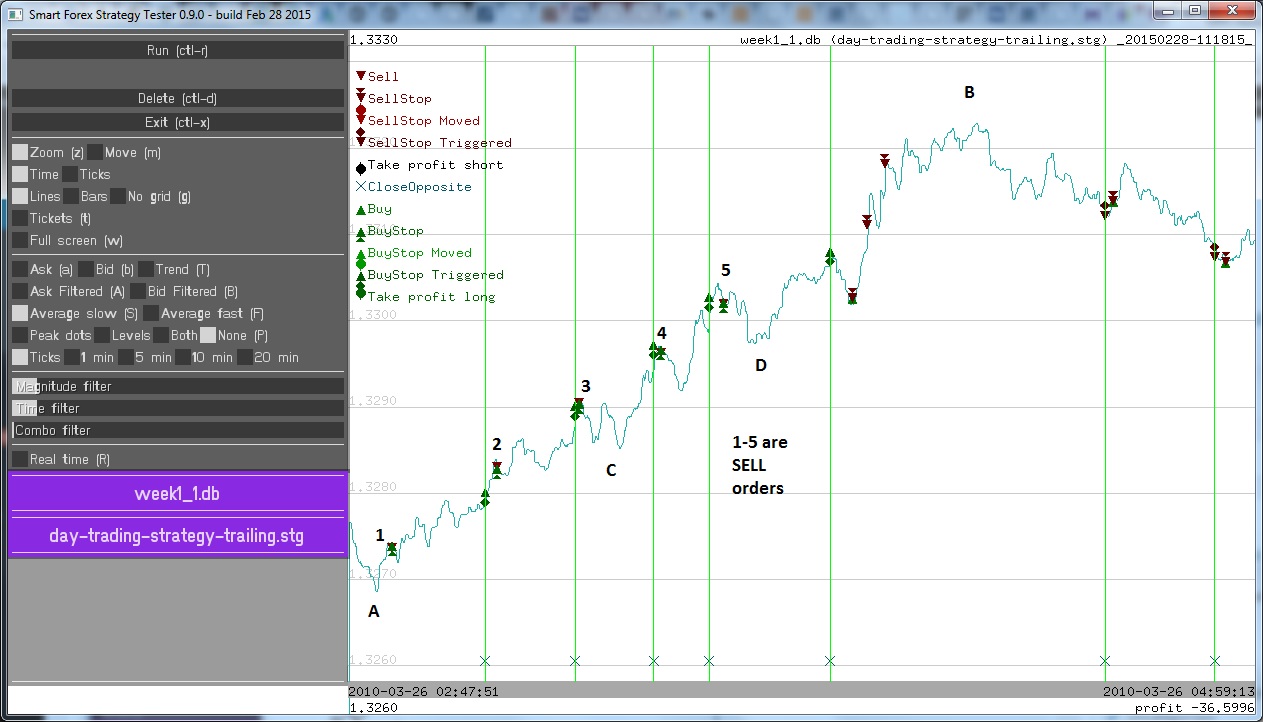
Our trading algorithm sets stop loss orders the next tick after positions opening, and then moves these stops in a trailing manner, securing the profit.
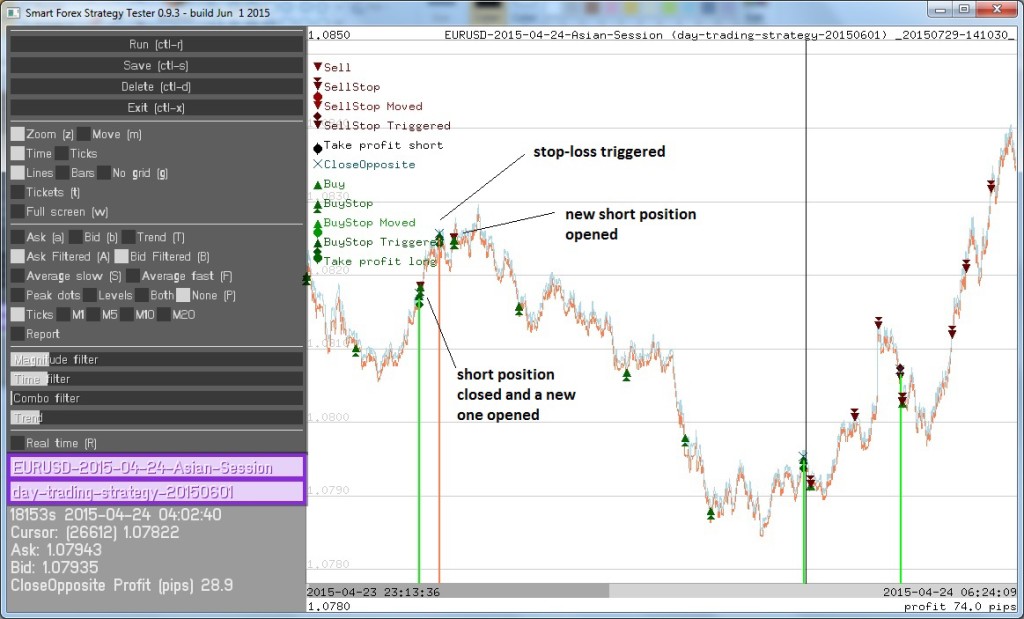
The screenshot below shows the very beginning of the test for the April, 24, 2105. In this baseline testing example, take profit value was set to 8 pips. Also stop loss orders were placed at a 8 pips distance from the trade, and were trailing market in the same increments.
Smart Forex Tester – Regular Stop Loss Orders
The first position opened was a short. We see that this sell order was closed profitably (leftmost green line). Few ticks after, the algorithm placed another sell order, which was a loser (leftmost right line). The stop loss oder was triggered almost immediately as the market continued higher.
The question is whether we would be better off setting the stop threshold looser? At least we could have the first position stay open longer, as we see that eventually market peaked and went down. And then we wouldn’t have the second loser trade at all.
On the other hand, with tighter stop, we had losses on the second trade, but then a new short position was opened very soon. And it turned out a success. You can see the stop loss order was trailed 5 times before it was triggered. The position yielded about 30 pips of profit.
Let’s see the test results for the looser stops.
Stop Loss Orders Set Further From Market
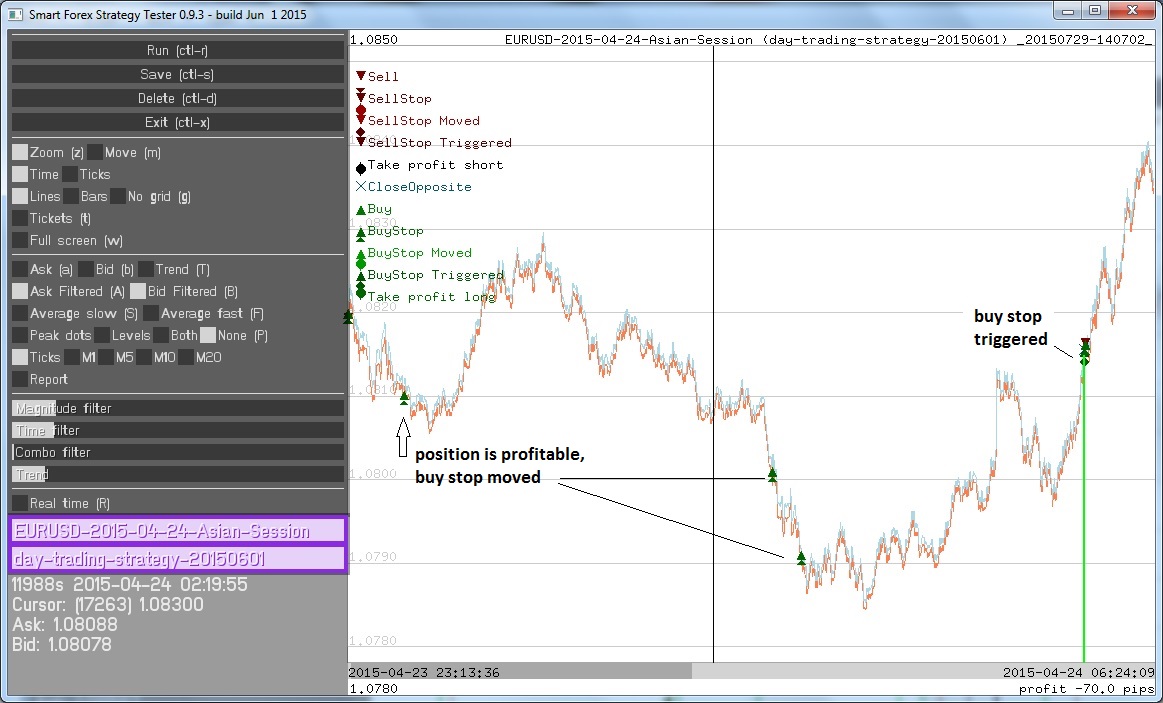
Looser stops might be justified for trades with low leverage or without it. To simulate it, we increased the threshold for triggering stop loss orders. In the example above, we set it to 20 pips instead of 8.
Smart Forex Tester – Stop Loss Orders Set Looser
As expected, the first position was closed much later than for the tighter stop value. And we avoided placing the second (loser) sell order.
However, this didn’t increase our profit. As seen on the screenshot above, the looser stop loss order was also triggered later (green line) so the profit potential was used only slightly.
This simple example brings us to the conclusion that the algorithm must use some logic to modify stop loss orders and also adjust to the market situation.
Stop Loss Orders Modification Algorithm
First of all, it appears we should differentiate between the cases of initial placement of a stop loss order and the case of its trailing. If looser stops are acceptable as such (e.g. no leverage), then it might make sense to wait longer for testing the market entry decision.
But when the position becomes profitable, the stop loss order should be moved closer to the market. And even closer for each subsequent move. This will secure more profit when the market reverses.
Moreover, while moving the stops, we can make the distance between the stop and the market proportional to the size of the preceding market’s advance. In other words, the faster-moving is the market, the slower we can afford to approach it.
If a stop loss order is triggered during a counter-trend movement, it’s the trading algorithm’s task to re-enter the market.
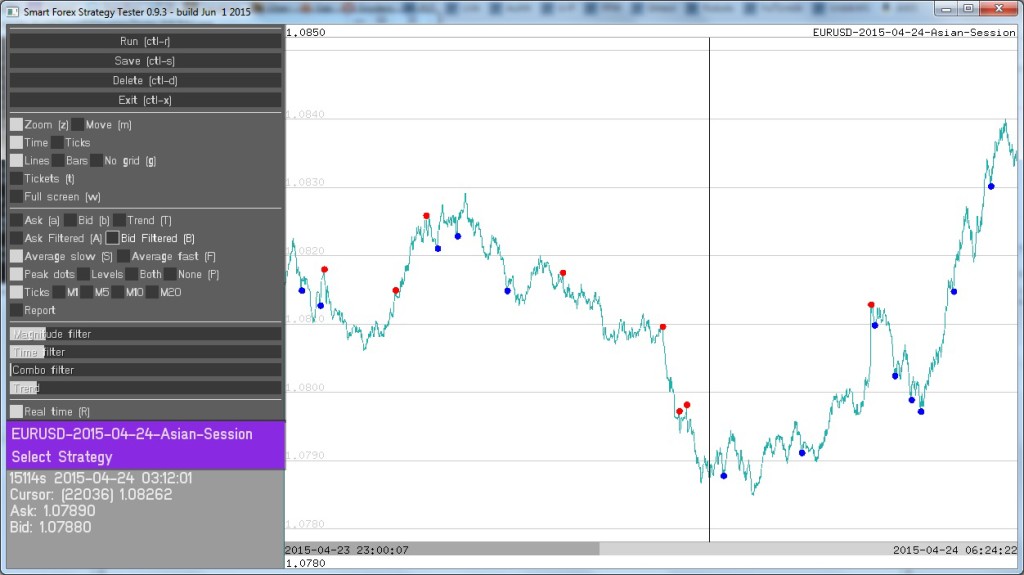
On the screenshot below you see the same market data with detected peaks (red dots) and bottoms (blue dots).
The accuracy of the detection might not look ideal, but keep in mind that it was performed in real time! Meaning that for each detected extreme, only the market data that was available prior to that time, was used. And also note that the market data plotted is smoothened for better readability. Whereas the detection has to use real-time quotes that might fluctuate quite a lot.
Smart Forex Tester – Pivot Points Detection in Real-time
However imperfect, these signals are good enough for our purposes of modifying the stop loss orders. So, e.g. for the looser stop, if we used the bottom signals, we could have 2 of them around the very bottom and could have fixed almost maximum possible profit. See the 2 blue dots to the right of the black vertical cursor line in the middle.
This post is a comprehensive example of Forex strategy testing with our Smart Forex Tester software. We used our example automated Forex day trading strategy.
Our test plan was to run the strategy on all Asian sessions for one month. The strategy is very simple and it doesn’t adjust its parameters to the market conditions. So we wanted to keep all algorithm’s parameters the same during the testing.
Asian sessions were selected as test data because their volatility is known to be low. It is important, because our simple strategy doesn’t have a trend following algorithm.
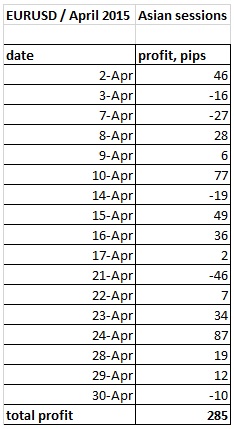
We tested on EURUSD. We used tick-by-tick market data provided by TrueFX. We took a whole month data file for April 2015 and prepared our test data with the help of our Forex Data Manager software (download).
Overall test results were positive. Total profit exceeded 280 pips. Out of 17 trading sessions, 12 were profitable.
Day Trading Strategy Test Results
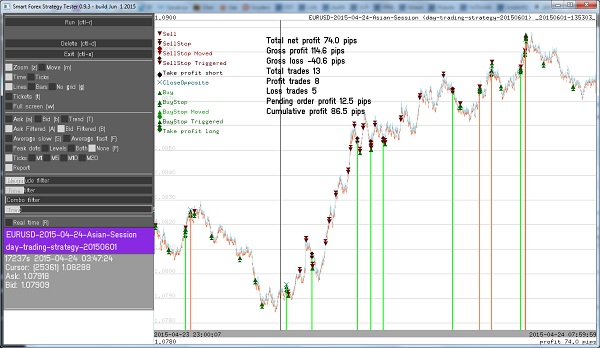
The best result we got for the April, 24. We can see that our algorithm managed to enter the market at tops and bottoms quite well and stop orders’ trailing worked properly as well.
Forex Day Trading Strategy Testing – The Most Profitable Asian Session
As the algorithm doesn’t have any trend following functionality, we can only explain this fact by the slow enough market movement.
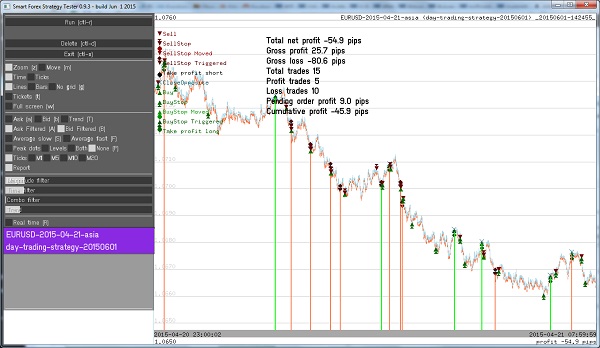
The worst session was on April, 21. This can be attributed to visibly higher jitter in quotes, so our algorithm had a lot of false signals.
Forex Day Trading Strategy Testing – Asian Session (Worst Case)
Interestingly, we could easily turn this worst trading session into a profitable one by tweaking the Pivot Points detector parameters. But we didn’t do that as this was against our test plan.
However, this observation is one of the most important results of the testing, which gave us strategy development ideas.
If you want to repeat our testing, here are our parameters.
Our testing results show that automated day trading can be profitable.
Our strategy is very simple but still it could win 70% of all trading sessions!
It is clear that priority needs to be assigned to implementing algorithm parameters adjustments on the fly.
An obvious idea to try first would be adjusting the detector parameters. We can optimize them on each tick (or, say, every 10-100 ticks) using the data from beginning of the test. This way, the jitter observed on April, 21 would have been easily eliminated.
We show how we prepare tick by tick data for our Forex strategy testing. Test data quality is one reason why we don’t use Metatrader Strategy Tester – it is generating ticks by extrapolating M1 bars data. Such artificially smooth quotes are not reliable test data. So we only use real market data.
We use the tick by tick data provided by TrueFX. It is real tradable quotes data – and it is free. History market data is stored as a separate *.csv data file for each month. The only problem is that the size of a monthly file is substantial – for a typical month it exceeds 200 MB, which makes it too big for MS Excel to open.
Tick By Tick Data Editing By Forex Data Manager Software
However, working with big data files is not convenient and is also not always reasonable. E.g. we don’t test on the data intervals spanning over weekends.
To get the most of the real market data, we have developed Forex Data Manager. This software reads a month long tick by tick data file, checks data integrity and parses it into trading days. Then we can select smaller chunks of the data in the GUI and save them into their own files. We can save one or multiple trading days or even less than a day – e.g. a single trading session.
Forex Data Manager is included into Smart Forex Tester bundle (Download). After you unzip the archive, start the software by double clicking on fdm.exe.
In the example below we show how we parsed the EURUSD data file for April 2015 and extracted Asian sessions as separate test data files.
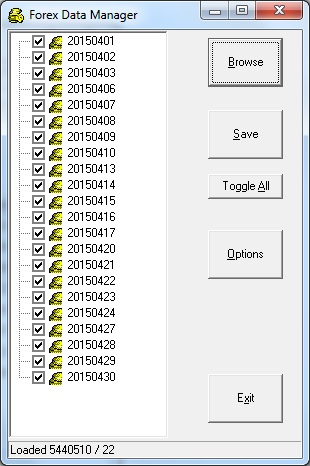
In the GUI, click Browse and select a full month tick by tick data file that you downloaded from TrueFX. After parsing is complete, you will see the following:
Tick-by-tick Data Editor Software GUI
By default, all trading days are checked. To remove selection, click on Toggle All. Then you can check one or multiple days and click Save.
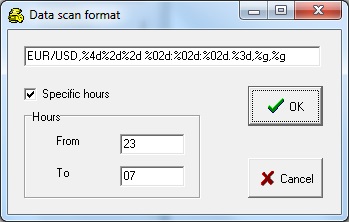
We will be extracting the data for Asian session. It is more complicated as it spans over 2 days: between 23.00-08.00 GMT. For that, we click on Options and check the box Specific hours and then type in the From and To values as shown. Note that we typed 07 – which means that all ticks until 07.59.59:999 will be included.
Tick-by-tick data editor: selecting data by hours
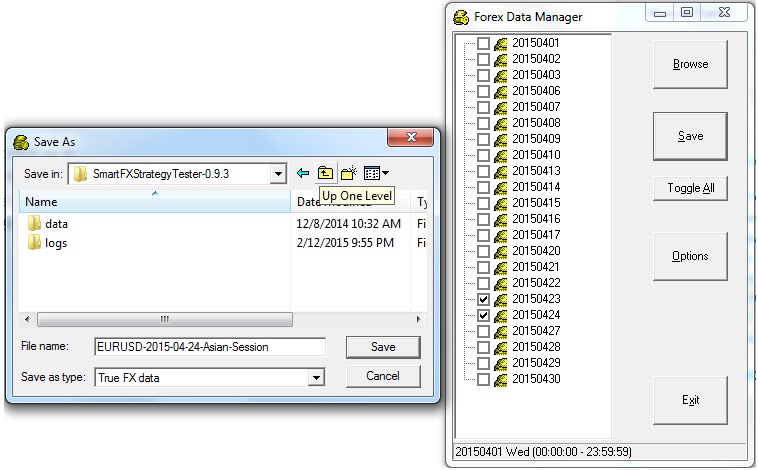
Now, we click OK and we select two adjacent days, e.g. April 23rd and April 24th. This means that we will be saving a data segment spanning from 23.00 of April 23rd until 08.00 of April 24th.
Tick-by-tick data editor software – saving selected data
You give a file name and click Save – the process is completed. We included this saved session file as an example in the Smart Forex Tester download bundle.
Why are we interested in Asian sessions?
Because there is less volatility there and usually there are no breaking news and other market moving events like e.g. FOMC press-releases. It is often recommented for newbee traders to start from Asian session.
We used this data for testing our example Forex day trading stratedy. This algorithm is very simple and doesn’t have the trend following functionality, so this setup suits perfectly.
This post continues the topic we started in our latest post on the adaptive trend following strategy. All figures refers to the example of a trend that we covered in that post.
Our Forex Trend Indicator Works In Real Time
For automated trading strategies that we develop and test with our software, we only use indicators that work fast and a value is available ideally at every tick.
Our trend indicator works in real-time as well. It is recalculated on every coming tick using a sliding window of a fixed length starting at the current tick.
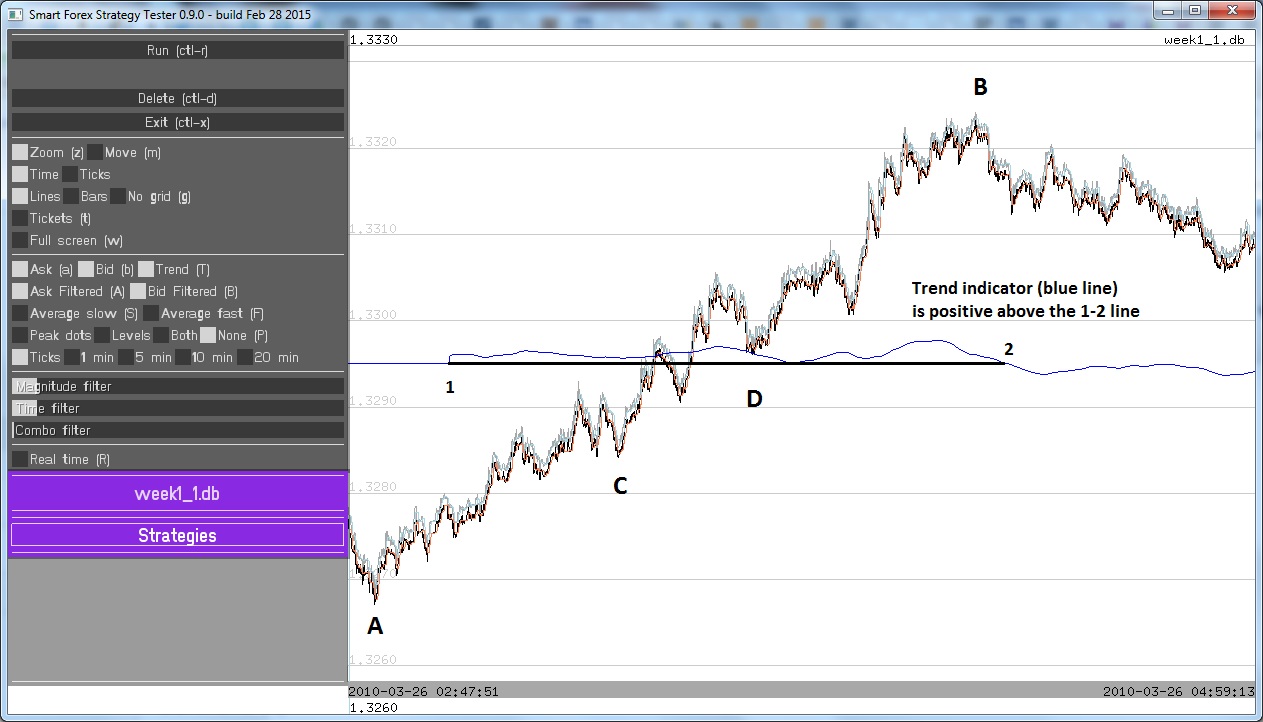
Let’s see how the indicator works. The figure below covers the same interval as the figure 2 in the post on trend following strategy.
There we noticed, that staying in the market in points C and especially D is not easy – risk looks very high and you might want to take profits.
How Forex Trend Indicator Works In Real Time
The trend indicator is plotted with a blue line. It starts from the horizontal segment on the left, which is a zero line. The indicator is zero, as there is not enough data yet to fill the full computation window.
But once the indicator start getting calculated (starting form the point 1), trend indicator yeilds positive values – until point 2. So we can see that if our automated strategy used this indicator, it would not exit the market in C nor in D.
You can download the latest Smart Forex Tester software and try analyzing the trends yourself. Use the trend-checkbox on the left panel to turn the indicator on or off. You can also adjust the computation window size with a slider control (requires data file reload!).
Starting from the next release, this Forex trend indicator will be also made available to trading strategies as a signal. Then we will include it in our trading strategy and update the below example to see how will trend indicator works in practice. Stay tuned!
We can see that market entry in pivot points is flawless. But the direction is wrong. So it will be really exciting to improve the strategy by adding the trend indicator and retest.
In any market, including Forex, trend trading is potentially the most profitable. However, to get decent profits, you need to catch a trend early enough. Which is not easy, but doable, because Forex trends usually last quite long.
What is considerably more difficult is to have enough self-control and not to leave the markets too early. Market doesn’t move in a straight line and it’s impossible to predict where the market tops or bottoms.
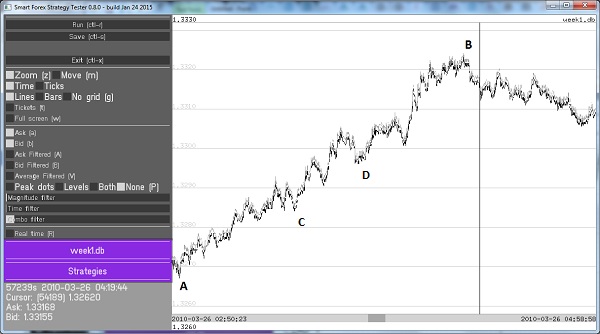
In hindsight, spotting a trend is an easiest task. This one a clear trend, right? From the bottom A to the top C market advanced almost 200 pips! And along the way, the rise from A to B looks even more obvious. It appears easy to get in somewhere in between and still have enough profit potential.
On Forex Trend Trading Strategy Development – Big Picture
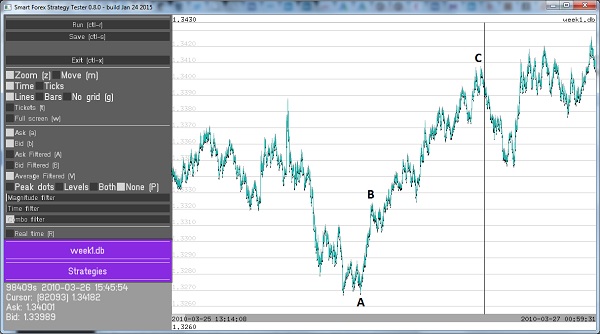
But let’s take a closer look. The next picture shows the closeup between A and B that covers about 2 hours of trading .
On Forex Trend Trading Strategy Development – closeup
You can see that A-B that seemed an obvious trend on an averaged graph, now looks completely differently. And when you follow the market in real-time, the picture will be much more uncertain. And this is exactly the timeframe where decisions have to be made.
You get the idea. Suppose, you are extremely lucky and entered a trade at the bottom A. Will you still dare to stay in the market at C? Or D, for that matter? And in the big picture, A-C or A-D are only small fractions of the whole trend.
So what trend trading strategy should we use? Which works better: wait for the ultimate top or bottom and lose profit or fix profit on reaching a certain level only to watch how market continues to advance in the same direction? How to address this dilemma?
Forex Trend Trading Strategies Need Adaptive Algorithms
In our opinion, Forex trend trading must use real-time strategy adaptation. And it needs reliable and fast signals about local tops and bottoms. We are developing our trend following strategy based on signals from our pivot point detection algorithm and our real-time trend indicator.
The main idea is to try to enter market on very early signs of emerging trend – not to be late. This is impossible to predict, as any trend indicator won’t give any signal so early. So we need to do it by trial and error. And tune itself on the market as trend develops.
Here is where our pivot point analyzer comes very handy. It can nail a top or bottom very accurately – and in real time. This is important as it gives us a chance to win some pips on the counter-trend movenens – even if we didn’t guess the bigger trend direction.
And this buffer allows us to take more risk. Suppose we decided to call a market top at the peak to the left of D. And opened a short position to trade a possible market reversal. We have in this case enough potential not to lose when the market eventually ends its correction in the point D. And we can use the same approach and enter the market at D againg, but now in the opposite direction.
Another level of adaptation is the pivot point detection algorithm itself. We can use the market direction information for more reliable pivot points detection. The idea is to introduce asymmetry in the peak analysis process.
So, e.g. for an ascending trend, we need to raise the detection threshlold before picking a possible top candidate, because the chances are higher that the market will continue higher. At the same time, we need to lower the threshold for bottom candidates.
Adaptation is also needed to adjust the thresholds depending on the nature of the trend: the steeper it is the bigger changes are needed in the threshold values compared to the default values that work in flat market conditions.
What is the best Forex strategy? Or should we fisrt ask whether such thing as the best strategy exists? These are literally “million dollar questions”.
But before even thinking of the best strategy, let’s try to understand what a good strategy is. How can we define it?
The obvious answer is that good should be a synonym to winning. This is true of course, but we are afraid there is just no such thing as “always profitable Forex strategy”.
So better answer would probably be that a good strategy is winning with 50%+ probability in some predictable market conditions. If we can’t formalize them, the use of the strategy would be questionable. An example of what we mean can be market behavior aroung a major news release. There are known patterns, e.g. price might shoot in one direction, then turn on a dime and go even further in the opposite direction.
Next, we need to find reliable numerical criteria of evaluating a strategy and so be able to compare strategies to each other and rank them.
But back to the question, how can we find the best Forex strategy? To do so we need at least a broad selection of them to test and compare. How can we do it?
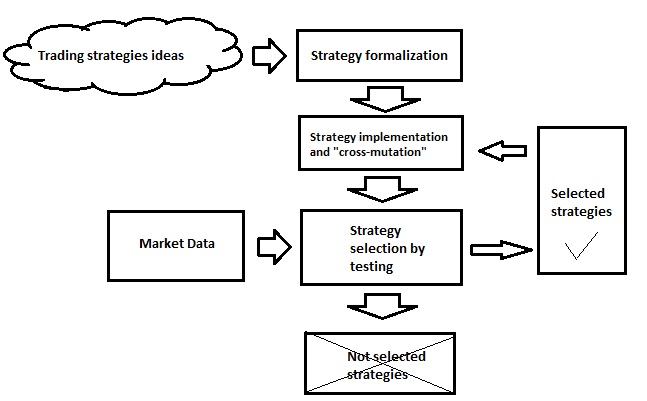
Breeding The Best Forex Strategy
The idea that we are going to try is to reuse the principle of evolution. Imagine that each trading strategy is a creature, and they are all exposed to hostile environment (which means we put them to the difficult tests). We can then make selection based on the test results and implement cross-mutations between the selected algorithms.
The Best Forex Strategy Selection By Genetical Approach
The whole process must definitely be automated. Manually we won’t be able to do much. Can we do that?
First of all, need the adequate software tools that will make it possible.
the strategy development framework that can efficiently generate strategies, make changes in them and merge them automatically (cross-mutation)
strategy testing environment that makes automated testing and selection.
The very same ideas and algorithm for market entry are fully applicable for exiting the market or taking profits. Here we won’t discuss the case of exiting the market with a stop-loss. And the most important case where this method is needed is trend following.
Standard practice of taking profits is placing a takeprofit order with trailing. Trailing order follows the current market value, being behind it for configured number op pips. At the first glance, the idea is excellent, but the problem is again the market volatility. Trailing order only goes in one direction, so if placed too close to the market, it can be triggered by a pullback. This happens a lot, e.g. because many market operators like to do “stop hunting”.
We suggest using our algorithm to make trailing logic more flexible. To avoid excessive or false triggering, we set the stop level far from the current market level. Basically just over the break-even level. And next we are detecting the local extremes by our algorithm. Once they are identified, we move the stop order close to the extreme. If the market continues moving to the same direction, and we are lucky and the order is not triggered by a pullback, we just repeat the procedure until the stop is triggered.
Trend Following Is Benefitial Only With Accurate Signals
Once the stop is triggered, we are waiting for the next significant extreme in the opposite direction and decide whether we want to re-enter the market in the same direction. This can be lucrative if the trend resumes. However, we can never predict that, so at some point the last re-entry will most probably be a loser.
There is also idea to profit from pullbacks. Which is often called “catching a falling knife”. Which means that having fixed our profit, we open a position in the opposite direction.
This is extremely risky trade, but on strong trends it can be very profitable.
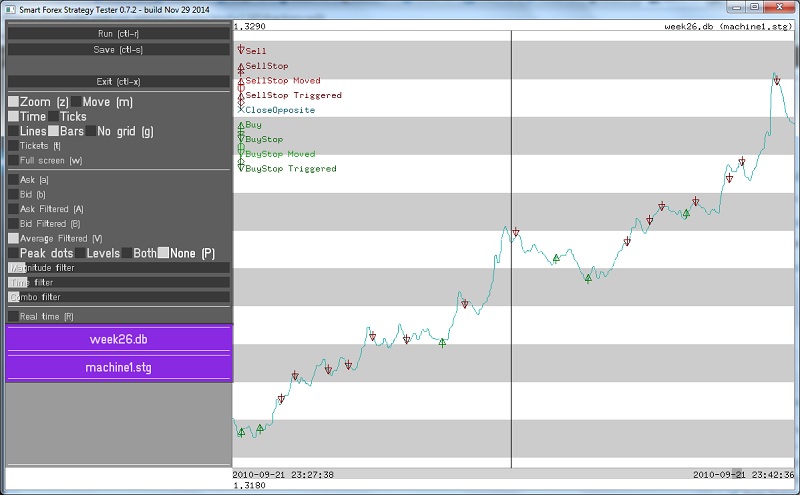
For trend following trading strategy, we use our pivot point analyzer as a trend indicator. As the figure below shows, once we have a trend, the output of the detector is mostly the peaks in the same direction (maximums for the uptrend seen on the screenshot). This, along with other simple geometrical measures makes trend identification quite reliable.
Trend Following Forex Trading Strategy: Trend Confirmation By Pivot Points Analyzer